


Three Geomedia
Working on the same principles as the phonograph, but reading tremblings of the ground rather than of the air, scratching out in real time invisible actions in visible form, the seismograph betrays its origins in the mechanical era. Today a second, more arithmetic form of data visualisation diagrams a numerical data set such as the one derived from instrument systems in place to monitor the health of the Animas River. A third form, financial visualisation software in commodity markets, not only gives direct accounts of geology (reserves), human interventions in them (extraction) and simulations of their likely use (futures) but actively produce those futures by fixing future trading prices. These three geomedia—vectoral analogues, numerical translations, and direct data—have significantly different means for handling time, with implications for the increasingly punctual subjects they presume, to the extent that it is not at all clear that the subjectivities they address, enable or create are human.
I
Given his literary background, McLuhan can be forgiven for obsessing about the printed word; and art historians, trained to attend to painting, sculpture and architecture, can hardly be blamed for overlooking other arts. But the general failure of the humanities, for much of the last 150 years, to notice the immense visual revolution brought about by intaglio printmaking is less condonable. Directly relevant to our discussions is the importance of printmaking to cartography and to the kind of conceptual mapping that characterised the Renaissance from Paracelsus to Ramon Llull. Equally so, in their fascination with the post-retinal arts perhaps, the humanities have turned a blind eye to a technical revolution that began in the late 18th century. For the first time since Alberti and Mercator, a visual language worthy of Cassirer’s term symbolic form (see Philosophy) has not only appeared but spread almost universally through scientific and popular media, a visual grammar capable of making as many and as varied a set of statements as perspective or mapping, and which I will gather under the collective description data visualisation.
This is not to deny the great scholars of artistic and popular prints (among them Griffiths, Prints; Ivins, Prints; and Mukherji, Graven Images), or the work of those researchers who have tried to gather attention around data visualisation as a professional and popular medium (in the first instance Halpern, Beautiful Data; and Drucker, Graphesis). In my own field of media and communications, we have been equally slow in bending our attention to workplace media, despite their growing influence on the aesthetic and perceptual underpinnings of contemporary life. The growing body of work on scientific instruments (notably Galison, Image and Einstein’s Clocks; and Daston and Galison, Objectivity) is further testament to increasing interest in the mediation of knowledge, and the consequent question whether mediation forms knowledge at least as much as knowledge frames instruments and ways of visualising its objects.
This paper is less concerned with the integrated networks of instruments gathering geological data, and more with the consolidation of mediated earth-observation into visual communications. My concern is not so much with the question of truth to reality as of truth to data. In another paper I hope to address how far the expression of the world as data is a world-forming as much as a world-picturing activity. Here however the interest lies not in the nature or accuracy of the readings instruments give of phenomena, but rather in the modes of mediation bringing the resulting data to human users, modes which include digitisation, translation, transcription, encoding, transmission, decoding, processing and especially expression. Similarly this paper does not deal with the framing of data visualisations in their onward transmission through news, current affairs and entertainment media, workplace and policy discourses, or their eventual efficacy in supporting or altering prevailing beliefs and actions. It is however written in the belief that the principles of mediation underpin the design of instruments and their articulation, for example in the management design of international meteorological networks and the operations of press officers and media professionals in conveying data to public networks. The ultimate credibility of geological data rests not on the accuracy of instruments, nor on the agenda-setting and framing activities of media outlets, but on the techniques of expression and delivery that are the key concern of this paper.
A particular challenge for data visualisation media is the handling of time. Joseph Priestley’s A New Chart of History (1769) and William Playfair’s Commercial and Political Atlas of 1786 established the horizontal time axis as a standard that, even in their static diagrams, implies animation. The animation is not limited just by the technology of printing but because these diagrams relate time to only one other variable (or an algebraically composite variable); and rather more significantly for the present enquiry because they spatialise time. Prints have several technical drawbacks too, the most significant being that it takes considerable labour to convert information into drawings, and drawings into engravings. This means that in general prints can show us, in geological terms, where a mine is, how many mines there are at a given date, or what a mine looks like in section at a specific moment in its history, but not the changing relations between these displays. The Frontispiece to Lyell’s Elements of Geology of 1838, carrying the intellectual freight of his 1830 Principles, witnesses the cracking open of a new conception of time, but does so without moving.
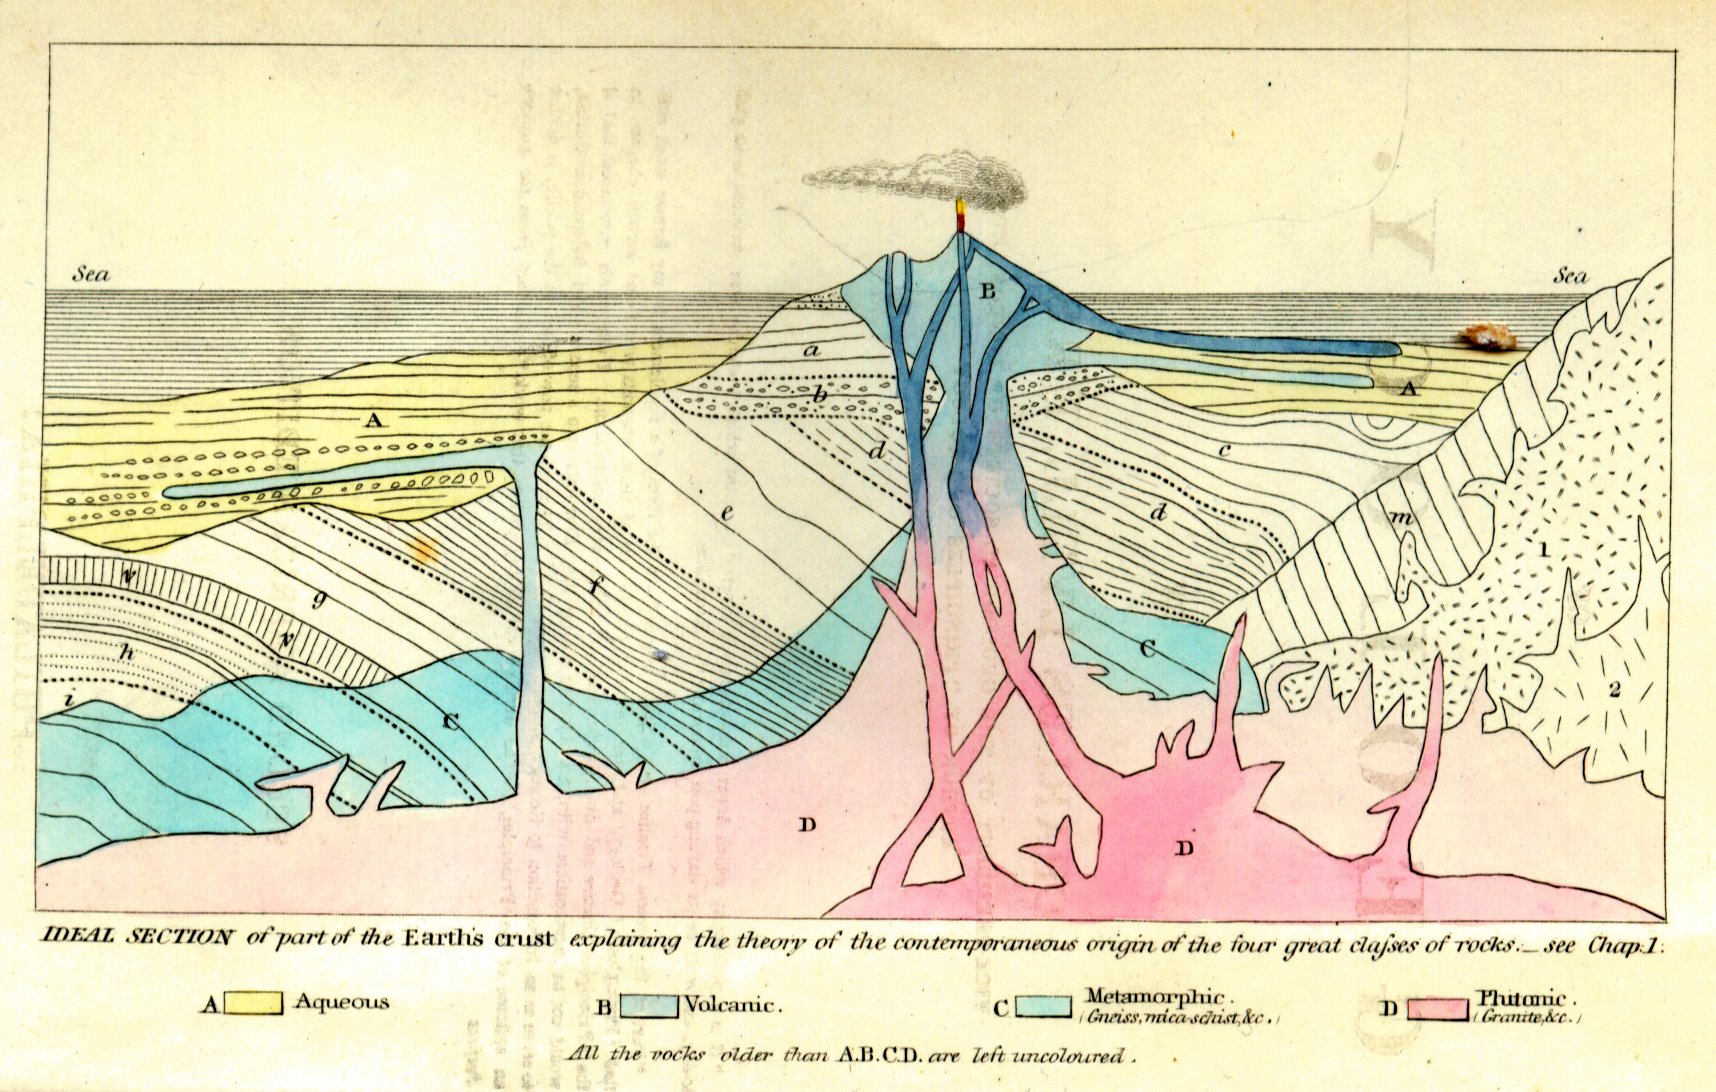
The frontispiece from Charles Lyell's Principles of Geology (second American edition, 1857).
Twelve years later, in 1842, the seismometer was invented, ascribed to the devout Scottish glaciologist James David Forbes, though earlier pendulum based designs were in use in Japan, and are reported as early as the second century BCE in China. (Needham, Science, 625-35; as with other crucial visual technologies of the epoch like the magic lantern, there appears to be a direct connection with Japan in the development of the modern seismograph; see Reitherman, Earthquakes, 122-5). The seismometer, working on the same principles as the phonograph, but reading tremblings of the ground rather than of the air, scratching out in real time invisible actions in visible form, is the archetype of geomedia: an automaton that translates the inhuman into humanly-perceptible and legible form.
The seismograph still belongs materially in the mechanical era, when the vector was still in vogue. Today we are more arithmetic. A second form of data visualisation is more common, perhaps what we most expect: it diagrams a numerical data set which in turn derives from measurements of non-numerical phenomena. The ‘vast machine’ of weather stations and instruments—converting temperature curves and wind into numbers that can then be converted to graphs, charts, diagrams and applied to maps (see Edwards, Vast Machine)—are in the large scale also geomedia. Here I will concentrate on an earth-bound study of river monitoring, mirroring the complex of meteorological instruments and translations in the concatenation of observational devices used to track the consequences of an environmental crisis shifting minerals through watersheds towards the ocean.
Such phenomena-to-data translations no longer deal exclusively in real time or the accumulation of records: more typically, we use the accumulation of data to predict. Even in the case of atmospheric instruments systems not every place can be observed. Curiously then we find that simulations based on the dataset not only predict the future but also whatever is occurring now that is not being directly observed. The inevitable real-time delay of real-time media—the latency involved in digitisation and transmission—means that real-time decisions, such as what clothes to wear, are made on the hoof on the basis of the past rather than the present; while simulations extrapolate from the past the probable shapes of the future. Weather visualisations—like visualisations of social trends—project broadly normative accounts that allow readers to refer them to their experience of weather (or trends), all the while reducing experiences to epiphenomena of fundamentally predictable tendencies. Similarly, accounts of downstream flows of spilt hydrocarbons and tailings instruct us where to fish and drink, but leave our sensory encounters with sludge and smells on the riverbank, at the margin.
A third form of visualisation begins in data that are already numerical. Financial visualisation software is not obviously a geomedium, but the London Metals Exchange and other markets in commodity futures not only give direct accounts of geology (reserves), human interventions in them (extraction) and simulations of their likely use (futures) but actively produce those futures by fixing future trading prices.
These three geomedia—vectoral analogues, numerical translations, and direct data—have very different implications for the subjects they presume. What or where is the subject of geomedia? I am spurred to this question by an observation of Badiou’s: ‘You must always have at your disposal a network of concepts, of which ‘subject’ always designates the articulation, without being able to situate within this network the point subsumed under this term’ (Theory, 285). Following Badiou’s ontology, individual instruments and measurements articulate one kind of subject; their articulation into systems of multiple types of instruments and measurements produces another kind of subject that, while it is articulated in and by the system, is not an integral part of it. We might hear under this statement of the problem Marx’s methodological adage that ‘The concrete is concrete because it is the concentration of many determinations’ (Grundisse, 101). Subjectivity, subjectivisation and subjection are products and processes, articulations of multiple factors, among which present purposes charged us with naming those which are geo-factors. What is the subject of geo-? It is the subject that deals with gravity, that distinguishes up from down, that typically lives on or very near a surface, and that orients itself accordingly. But it is also for that reason a subject very likely to be ignorant of its own conditions of existence. For ecopolitics, every human is a concentration of interactions with its environment, which it in turn remakes by breathing, ingesting, excreting, moving, sheltering. We may become conscious of breathing in certain circumstances, or by an act of will, but rarely even then as an ecological entanglement. The seismograph operates in this plane: we can remain largely unconscious of the Earth’s constant seismic motion; we only need become aware of it in moments of crisis.
I may not need a weatherman to know which way the wind blows, but logistically our corporate and governmental planning processes do rely on geological and atmospheric media for strategic risk management. Numerical translation media, unlike seismography, foster prediction, and have a normative actuarial function—to produce assurances—the reason for popular and governmental interest in them, if not the whole scientific rationale. No one agency needs to know everything that is happening now. Empirical gaps are plugged by probabilistic knowledge whose concern is with trends rather than the totality of events; or rather, they are concerned with the totality at the expense of the events comprising it. The third case, financial software, does however address the totality of events in real time. Until recently, such software described human activities to human readers; but now the vast majority of news of computer trades is generated by computers tracking markets and ‘read’ by other trading computers, so that financial visualisation has become a window into an increasingly inhuman universe of purely numerical activity which, however, translates into more or less mining, transport, refining, energy use, and dispersal into infrastructure and consumer goods—the newly anthropogenic geology (Parikka, Geology).
An instrument not only tells us about the phenomenon it is designed to measure, but about its designer. The same is true of the workflow from measurement to presentation. Subjectivation, the construction of subjection and subjectivity, derives not only from the instruments and measurements but from the formal attributes of these transmission and presentation media. The geo- prefix suggests that the predominant dimension of geomedia’s subjectivity is space, a hypothesis supported by the triumph of spatial grids in both workplace software and the construction of contemporary screens that also implies a concomitant suppression of time. The fine gradations within and between precise modes of temporal suppression in the three modes of geo-media, however, suggest that while containment of its object divorces geo-phenomena from time, the most significant dimension of the subject of geomedia is temporal.
II
The fundamental design of seismometers involves a mass suspended from a frame by a spring. The frame and recording device move when the Earth moves, but the heavy mass tends to inertia. The recorder traces the difference between the moving and still parts, giving a record of vertical movements of the Earth. A plotter pen on a revolving drum was traditional, but the friction of pen on paper was enough to give false readings, leading to the use of beams of light reflected from the mass onto photographic or heat-sensitive paper. Contemporary seismographs suspend the mass in electromagnetic fields, allowing movement in two dimensions, recording the amount of electrical force needed to keep the mass inert. Like its mechanical and optical predecessors, electronic seismometers amplify the movement, typically converting voltage readings into either analog or digital form for display (Nebeker, ‘Appendix B’). To keep the argument clear, I will concentrate on the analog read out, the plotter drawing near-symmetrical shakes on an unspooling drum of time-stamped paper. The paper itself is a major medium (Gitelman, Paper Knowledge), covered in lines parallel and at 90 degrees to the motion of the drum, graph paper to all intents, showing time on the parallel and scale on the vertical axis. To the unschooled observer, even without these measuring lines, the seismograph’s output makes sense, as it does in so many movies: hectic motion ‘means’ strong seismic activity directly, without need to understand the Richter (magnitude) and Mercalli (intensity) scales. In this restricted sense, seismometers are indexical media, making marks as a direct result of the movements they record; but also in a more particular sense of the index as a pointing finger: when we look at a working seismograph, we are looking at the finger as much as we are looking at what it’s pointing at. As vectoral analogue media, seismometers mobilise this double function of the index. They are analogues in that the shapes they draw are analogous to, or isomorphic with, the movements of the ground. They are vectoral in the sense that they record gestures, albeit mechanical ones, which have both size and direction—they move in time as well as over distance. In fact, modern seismometers often have three masses lying at angles to one another to respond to different aspects of seismic motion, including depth and compass bearing. Technically the extra dimension makes them scalar media. ‘Vector’ however keeps the sense of the temporality intrinsic to seismometers, whose recording drums advance under the moving arm of the plotter in order precisely to keep its timely intelligence.
Seismography is animated in the moment of recording, though it produces a record that can be analysed after the event. Its most curious feature is that the whole device moves except the inert mass, so the apparent movement is in fact the record of inertia relative to the whole planet moving around it. To ensure its inertia, the device is kept inside a wind-proof chamber, and isolated from accidental rumblings (traffic, shifting furniture, crashing waves which produce a permanent micro-seismic background) and from changes in temperature and the Earth’s magnetic field, using invar alloys that respond poorly to heat and magnetism. This isolation from the world makes visible the world’s movements, as if to prove TS Eliot’s lines about ‘the still point of the turning world’: ‘Except for the point, the still point / There would be no dance, and there is only the dance’ (‘Burnt Norton’, 191). In Eliot’s poem, the still point ‘where past and future are gathered’ is an ideal extraction of the conscious moment from time that allows time to proceed. In the seismometer, however, the world’s movement tracing itself against such stillness is the evidence of an utterly unhuman present that trembles constantly, and now and then erupts with sufficient violence that our human senses confirm what the instruments say. The motion of the frame, and therefore of the world attached to it, draws itself as a line of motion, rather than of stilled depiction, as in Fox Talbot’s photographic ‘pencil of nature’ (Pencil). Though it can only draw one quality of all the qualities that make up the world, and though the condition of its doing so is that it be as isolated as possible from everything else in the world, especially its non-seismic movements, the seismometer reverberates directly in sympathy with the Earth, and at the same time.
For this to be useful as a measuring device, the travel of the recording medium must be entirely reliable (which will also mean that any influence its motor has on the recording is easily subtracted from the reading, another moment of isolation). Like the standard frame rates of moving image media, the rate of travel defines the temporality of the device, but unlike film and video, the movement is continuous, another feature placing it in the vector’s field. The graph paper makes it easy to take numerical readings, but does not constrain the movement of the plotter, which remains analog. A solo seismometer is limited to establishing the velocity (or acceleration) of Earth movements, but not their direction or distance—that needs an array of seismometers, using the different times of arrival of seismic waves to establish how far they have travelled and from what focal source. So standardising the rate of travel of the individual devices in an array is critical to their functioning, and to making up for the isolating required otherwise for each machine to function. Such arrays then apply a particular, arbitrary but common rate of travel to the unrolling paper that functions as a measure of time, a measure that is logically subsequent to the event it records. Watching a seismometer in action, we have the almost uncanny sense of the world drawing a portrait of itself as we watch. It produces a record, but notoriously is unable to predict where the next earthquake will happen. Its time is therefore present, producing a past, and isolated from the future that appears only as the spool of unmarked paper waiting to pass the plotter.
The subject to whom this auto-graph of the world’s motion appears witnesses it in a form caught halfway between drawing and writing: a mark from which all meaning and depiction, all reference to language or appearance, has been evaporated; save only the pure fact of the plotter vibrating over the rolling drum of paper. At the same time, this unfolding act of marking is primal, in the sense that to make a mark precedes any reference it might have to speech or depiction. And in the degree that it is an unhuman agency that makes the mark, even if through a extremely artificial device, it creates a place for us, viewing it, as witnesses of an uncanny message from the underworld, with the distrustful fascination of the lady pianist watching the pianola keyboard in the skeleton dance sequence in Renoir’s Règle de jeu (1939). Even more uncanny is the knowledge that we are watching not the movement of the pen but its stillness as the Earth and everything on it moves. In this way the trace left behind, over which the scientist pores, is mere archive: a geomancy whose arcane markings we labour to read as if they were a language awaiting its deciphering, but knowing that they are the history of an entirely non-verbal, non-numeric, set of activities entirely without anything humanly recognisable as significance. There is an amazing purity in this self-inscription, and the echo of a primal confrontation with the excess of the world that infants must feel, and which we ascribe to the first humans. This access to the world is mediated, as is all human perception, but it is access to the world.
III
Seismography is a planetary science, even though earthquakes and volcanoes are largely local phenomena. The Global Seismographic Network, operated through the Incorporated Research Institutions for Seismology (IRIS), provides open, free, global information from a network of 150 stations monitoring seismic activity, researching the structure of the Earth’s deep geology and tectonic plate movements, and, as a side project, monitoring for the international nuclear test ban treaty (Gee and Leith, Global Seismographic Network). Sharing these quantities of data in near real time demands high-speed telemetry, involving networks almost as complex as those involved in global weather and atmospheric research, collaborating with atmospheric, ocean and space-based observation and reporting systems, as well as a huge array of fibre-optic and satellite communications media, all requiring a powerful standardisation of instruments, measures and protocols, not least in relation to military and commercial uses of seismic media, for example in oil exploration. If the single instrument stands as a vectoral analogue, its interconnection with a global system of Earth observation, especially the integration of analogue read-outs with digital telemetry systems, moves it towards the second of our categories, numerical translation.
Earth sciences give necessarily complex answers to what initially appear simple questions, such as the state of a river. On the 5th of August 2015, Environmental Protection Agency (EPA) workers attempting to control seepage from the abandoned Gold King Mine in Colorado triggered a massive leak of mine tailings into the Animas River, a tributary of the Colorado River (Cubitt 2016). The EPA lists eight laboratory techniques for assessing the amounts of metals sedimented into the river and related effects such as the solution of organic carbon in the water, plus a range of field methods. Lab methods include EPA Method 200.8 Determination of Trace Elements in Waters and Wastes by Inductively Coupled Plasma-Mass Spectrometry; Method 1631, Revision E: Mercury in Water by Oxidation, Purge and Trap, and Cold Vapor Atomic Fluorescence Spectrometry; and Method 218.7 Determination of Hexavalent Chromium in Drinking Water by Ion Chromatography with Post-Column Derivatization and UV-Visible Spectroscopic Detection. Field advice from the New Mexico Environment Department’s Hydrology Protocol (2011) referenced in the EPA’s Monitoring Plan (‘Post-Gold King Mine’), at the other extreme, includes among the recommended field equipment a clinometer, GPS, and laser level, measuring tapes and a long piece of string. Other field methods involve carrying into the wilderness professional equipment for chemical, biological and nutrient sampling in a range of invertebrate as well as vertebrate species, along with thermographs, flow meters and sondes.
Among the laboratory tests, ion chromatography works by filtering a sample to remove particulate matter and bacteria before introducing it into a pressurised column containing a resin that adsorbs ions from dissolved minerals. An ‘eluent’ or solvent is then passed through the column to separate the ions from the resin; the time taken to do so indicates what kind of metals are in the sample and in what quantities. The device is said to be accurate within the parts-per-billion range (Bruckner, ‘Ion Chromatography’).
Atomic fluorescence spectrometry uses a different approach, isolating and suspending samples and illuminating them with ultraviolet light, so that the excited atom emits a photon, whose wavelength is a fingerprint of the substance fluorescing, while the intensity of light emitted at various frequencies indicates the quantity present in the sample. Especially useful for detecting mercury in water samples, the process requires a preparatory phase when samples must be ‘digested’, typically in a pressure vessel filled with a strong acid which is heated with microwave radiation to enhance the solution of heavy metals like arsenic, selenium, antimony and mercury (Sanchez-Rodas et al., ‘Automatic Fluorescence Spectrometry’). It is the resulting free atoms that are analysed in the spectrometer.
There is an analogy to draw here between the filtration required for ion chromatography, the microwave digestion in preparations for fluorescence spectrometry, and the isolation of the seismograph from random earth-borne noise. Samples from the Animas spill would have been carefully marked with time-stamps and geographic markers so that the progress of the river’s healing could be followed. Undoubtedly, especially in the circumstances, EPA field officers would have been even more careful than usual to follow practice, for example rinsing the sample collection syringes three times in the sample water before filling. A number of manufacturers of these kinds of equipment offer all-in-one machines that will prep the sample as well as analyse it, cutting down risks of contamination. It is not therefore a question of the truth of the end measurement to the actual water, but rather of the abstraction of the measuring process from the river itself. As with the seismograph, the indexicality of the relation between fluorescence and chromatographic data and the original samples isn’t in doubt; what is intriguing is that the specific objects of interest have to be isolated from one another (the tests work on specific pollutants—in these cases either anions and cations or heavy metals—but not on others) and from other pollutants like particles of rock and microbial life. The narrow focus is what makes the translation from murky water to data possible. Even prior to filtration and digestion, the samples are exactly that: samples, static moments taken from the flow of the river. The process of gathering samples is as indexical as the practice of capturing still images, discrete instances, unique moments, described, in a rather literal sense, by the action of separating them from the ongoing flux of the ecology that they are tasked with evidencing. Even prior to laboratory preparation, field sampling has eluted the sample from its place, its networks of causes and interactions, the relations that constituted it, in order first to constitute it as a discrete object, then to reconstitute it as data, both steps undertaken so that the immovable river can be communicated. In geological media, place is always vital, and yet, in the sampling, place is reduced to its coordinates, just as the sample is established as an object not of ecological embedding but in a form already oriented to the production of objectivity.
The techniques for establishing the health of the Animas thus range from electro-magnetically induced plasma fields capable of measuring parts per quadrillion (10 to the 15th power) to a distinction between field observations described as Strong (‘the characteristic is easily observable [i.e. observed within less than one minute of searching]’) and Weak (‘the characteristic is present but you have to search intensely [i.e., ten or more minutes] to find it’) (New Mexico, Hydrology Protocol). If field scientists take a Munsell chart to get a numerical value for the colours they observe in polluted water, riparian foliage or the organs of dead fish, their observation is still in play when they decide between two proximate hues. The fieldwork, if it is to serve the overall and pressing task of tracking the flow of mineral pollution along the Animas and into the Colorado River, has to be conformable to a system that is fundamentally arithmetic. In this it differs from the seismograph, because it has abandoned the gestural geometry of seismography, but much more because it begins with a translation into numbers in the interests of feeding a much larger machinery of integrated human and mechanical observations. A seismograph’s output is humanly perceptible. The subject who knows, who sees and understands, who feels the simultaneity of graph and event, is a human individual. The subject of river monitoring is neither the field scientist nor the lab worker, not even the analyst, but Science, an imagined collective that knows what is too complex and too vast for any one human being to comprehend.
Seismography evolved swiftly from simple instruments to complex ones. As a global system, it moved from single instruments to networks of communicating instruments, already blurring my artificial boundary between analog and translation geomedia. Yet no matter how sophisticated the seismological network, earthquakes are notoriously impossible to predict, even the anthropogenic earthquakes caused by fracking (Philips, ‘Why Oklahoma’). The knowledge we get from real-time analog measurement of quakes or eruptions is always too late. The temporality of river monitoring is different, for two reasons: because it takes time for samples to become data; and because the object of knowledge is not the present state of the river so much as the history of its movement from, in this instance, the Gold King Mine disaster to relative health. The seismograph tells time as it occurs; river monitoring establishes a history. Of course seismologists maintain records and seek some probabilistic way of forewarning about tectonic movements; and of course river monitoring aims to provide knowledge as to whether I can swim in or drink the water today. Still, there is a fundamental difference between real-time analogical media and constructed numerical translation, most of all in the gap between analogue processes and their representations for human observation, and what that implies for the subjects that know their results.
IV
Seismology and river monitoring describe anthropogenic events as well as natural processes with minimal human involvement. They indicate change (with all the weight of the Peircean index). The third form of geomedia I want to address here, financial software and its visualisations, is itself an agent of change. As Pryke argues, under certain circumstances,
visualization software brings markets, or perhaps more correctly critical components of markets . . . into full being and, in so doing, these technological artefacts stand to alter the formation of financial knowledge, in terms of both its geography and its potential consequences (Pryke, ‘Money’s Eyes’, 434)
Such financial knowledge is not collected for its own sake, or to forewarn or prevent, but to apply. Amassed records of seismic events do not give scientists a means to predict future occurrences; only a general map of probabilities. River monitoring on the other hand offers a database that can be used with reasonable accuracy to predict the effect of variables like seasonal water flows, sedimentation rates, artesian groundwater extraction and further damage to local tailings dams on the future health of the river. If Pryke is correct, financial software and its visualisation tools can actually bring features into existence (see also Davison, ‘Visualising Accounting’), a thesis born out by the proliferation of new concepts and practices in the derivatives market. The application of this knowledge produces profits, but it also produces actions in the world geared to those profits. A geomedium’s relation to historical data—as repository; as a source to learn from and to influence policy; and as resource to be mined in order to create future actions—opens a question about who is the subject of the knowledge they produce, which we can approach through a study of their differing temporalities.
The computerisation of finance began in automated exchanges in the 1980s, swiftly followed by computer-mediated point-and-click trading on automated exchanges, and more recently automated trading, which increasingly demands high-frequency trading (HFT). Automated trading comprises two forms. Execution algorithms mediate human-instigated actions, for example splitting a large order for shares into numerous smaller orders, for each of which the algorithm seeks the optimal timing, so as not to spook the market or reveal a strategic purchase or sale to competitors. Proprietary-trading algorithms are the second form of automated trading. MacKenzie and colleagues (‘Drilling’) distinguish five sub-genres in this category: (1) electronic market-makers that, taking the role of human pit traders, broker trades by buying at best price and selling at best offer, taking very small margins on deals but doing so in large volume; (2) arbitrage between markets, finding small margins between prices quoted on different stock exchanges; (3) statistical arbitrage, which operates on identifying patterns in particular markets and gambling on trading returning to norms; (4) algorithms that seek out execution algorithms and anticipate their strategies; and (5) the automated practice, illegal since the Dodd-Frank Wall Street Reform and Consumer Protection Act of July 2010 but nonetheless current (and possibly re-legalised by the Trump administration), of placing and withdrawing orders in order to create spikes in prices.
Common wisdom indicates that 75% of trades in contemporary financial markets are algorithmic, machine-to-machine plays on the market, with HFT spotted at anywhere between a high of 84% (a figure said to derive from Morgan Stanley) and a low of 50%. Most commentators agree that the figure is highest in futures markets. For an idea of the numbers involved, on the US Option market alone trading reaches ‘4,500,000 quotes per second, and 8 billion quotes per trading day’ (nanex.net). These speculative markets, where high-speed trading extracts rents from contracts to supply commodities months or years ahead, are especially open to algo-trading. They are also the most powerful accounts we have of the immediate future of planetary geology. Cash values of future contracts for copper, oil, coal, uranium and other assets impact investment in mining and transport, change the valuations of stockpiled resources and raw minerals, change plans for constructing large communication, logistical and urban projects, and directly influence decisions on building energy infrastructure to power extraction and transport. They change government policy on housing mobile workforces and providing dams, roads and railways. To the extent that we are entering an era of anthropogenic geology, the futures market and its software is far more significant than media that merely warn of catastrophe. These financial media cause catastrophes.
Catastrophic events as measured by the market’s own terms are legible as Flash Crashes, but the ongoing catastrophe of resource extraction and ancillary industries is determined by more normative sequences of market events, which however are now occurring at speeds and in numbers way beyond the capacity of humans to observe, let alone intervene. The formal, aesthetic difference between finance software and the two systems we have looked into so far is that there is neither a relation of analogy, nor one of translation. Finance software deals with visualisations of activities that are in themselves already entirely numerical.
Nanex Corporation offers an API (application programming interface) capable of running on an ordinary laptop to handle data streams from 23 exchanges, from NASDAQ to the London Metals Exchange, including quotes, trades, and indexes like Dow Jones and FOREX, at speeds of over two million updates per second. This is not a system for trading but for observing the state of the market. We should think of it as a kind of porthole into a non-human world, the kind we see in old science fiction films where engineers peer through little windows into the spaceship’s nuclear motors. The computers actively engaged in trading do not need these kinds of visualisation. They have no need to understand or experience time as anything but a mathematical function. Massive investment in straight-line cable and line-of-sight microwave links to reduce communication lag times by nanoseconds gives competitive advantage to the fastest coms links. So swift are the scrolling events that, even in slow motion, Eric Hunsader’s animation of the 6th May 2016 eMini prices ping-ponging across the equivalent of 700 points on the Dow Jones Industrial Average lies at the threshold of perceptible, let alone comprehensible:
Eric Hunsadar, Wild High Frequency Trading Algo Destroys eMini Futures.
It has long been clear that only paying subscribers receive news from financial news services as it breaks: others can view stories only after a delay that makes the news far less valuable than it is in real time in trading rooms. Contemporary news services are designed to be read by automated trading computers, forming another layer of finance software. Newsfeeds for machines are not only alpha-numeric rather than verbal or visual; their value lies in speed just as much as accuracy, to the extent that co-location services—placing trading servers in closest physical proximity to exchanges’ servers to shave milliseconds from the lag between receiving news, placing a bid and purchase—are a booming revenue source for exchanges. At this level, ‘real-time’ no longer means the time of human perception. It belongs to a concertinaing of time, where past performance becomes standing-reserve, future repayments (permanently deferred) become present profits, and the present itself is truncated into a vanishingly small, relativistic point.
Media and communications scholars have not given contemporary workplace media the attention they deserve (honourable exceptions include Ned Rossiter’s recent Software, Infrastructure, Labour, on logistical and enterprise resource planning software, and my colleague Clea Bourne’s Trust, Power and Public Relations in Financial Markets). Spreadsheets, databases and geographical information systems were the dominant media of the early 21st century, because they were the media of domination. At that stage, even in the wake of the 1980s Reaganomic assault on bureaucracy, there was a sense that the contemporary world still had a rational subject. The integrated systems of the early 2000s reflected a belief, somewhere between the concept of Science as the subject supposed to know and the invisible hand of the market, that there was an ultimate subject of power: collective, internally antagonistic perhaps, faceless but not impersonal, who ruled. That trinity of fundamentally bureaucratic media—databases (filing cabinets), spreadsheets (ledgers) and GIS (maps)—still operates, not least at the level of companies and institutions, where it continues to provide the backbone of a residual early-modern biopolitics. A history of the types of mediation evolved since then indicates a new turn in modernity.
The media histories of accountancy, the management of human beings and of maps share a specific geometry. Early instances of each were chronological; increasingly through the first and second office revolutions of the 19th and 20th centuries, they become spatial. From graph paper to raster screen, governmental media came to adhere more and more rigidly to the geometry of the grid, which they now inhabit as their natural home. There are grounds to believe that the progressive spatialisation of video displays, from scan lines to absolutely rectilinear LCD and plasma screens parallels changes in perception; and far more to suggest that the reorganisation of time as y-axis in a wholly spatial matrix produces a capacity for rule that Virilio once referred to as the paysage d’évènements, the landscape of events as they appear from God’s perspective (see paysage). The subject-in-dominance that does the work of knowing under these conditions is quasi-theological: not an individual, or a human collective. Numerical translation geomedia address the imaginary community of Science. The One who knows the workings of the finance market no longer addresses networks which, even if they blend humans and technologies with physical phenomena, do still address the human. This new One who knows is the market, and the market has decreasing connection with human agency. The most powerful engine of geological change no longer speaks from, to or with humans, who can only observe it in operation. Post-truth politics are in this sense a suitable response to a mediation of truth for which humans are externalities.
The transitions between these three modes of geomedia, in more or less chronological order, trace a historical positioning of what might be understood as an increasingly punctual subject, in both senses of the word: that their subjects are constructed increasingly in order to occupy a point in space, a point they arrive at, at exactly the right moment. At its origins, animation brought inanimate things to life and gave them a soul. Today animated but unliving things allow us to observe them, in media like Nanex, that give the false impression that we can intervene or even react to a capitalism in the process of shedding not only the last pretences of humanity but its last connections with the species.
According to Stephen Graham, ‘computer software mediates, saturates and sustains contemporary capitalist societies’ (‘Software-sorted Geographies’, 562); for Beunza and Millo, the solution for data saturation is not speed but what they refer to as ‘blended automation’ that allows human agents to interact with software (Blended Automation). Neither view closes in on the truth as it emerges from this brief genealogy of geomedia, that contemporary capital is already entirely blended, but that in the ferocious compression of both time and subjectivity, there is no longer a pre-existing human society to which software is a supplement. Nor is a metaphysical sleight of hand possible that would read software as prosthetic or as an extension of an always-already technological humanity, both of which theses invoke an already existent and discrete humanity. If there is an end of history thesis to be hypothesised, it will involve the eradication of history through its reduction to standing-reserve of data. The pre-eminence of the human in human affairs gives way to self-operating systems, driven by motives designed into them by humans but now outstripping human agency. The love child of William Whyte’s organisation man (Organization) and Stafford Beer’s cybernetic management (Cybernetics) is the corporate cyborg, a self-operating enclosed system for which humans are merely biochips. The genderless, raceless, sexless work of finance software belongs to its indifference to human differences; which in turn suggests that, as negation of sex, gender, race and indigeneity, it is in fact deeply involved in their generation and governance.
A core function of visualisations in the finance sector is risk management. If on the one hand, consumerist individualism provides a motor for innovations that capital can no longer produce for itself, on the other those individuations pose risks if they innovate in the interstices of the system’s smooth running. Navinder Sarao, the trader whose algorithm was blamed for the 2010 Flash Crash, used the fifth kind of trading technique, spoof purchase orders never intended to be completed but to cause spikes and troughs in market prices (Reuters, ‘British Trader’). Sarao is accused of making USD40 million from his bedroom in his parents house in the West London suburb of Hounslow. There is no way to expose his motivations, inside or outside the numerical world of the market. But that ambivalent position, the position equally of hipsters and other lifestyle groups, is precisely the risk that haunts capital at the border along which it seeks to enforce the externalisation of human motives. The corporate cyborg erases difference only to be haunted by it in the form of risk. In such cases, as in the calculus of desire and hatred triggered in recent populist electoral campaigns, lifestyles otherwise easily assimilated into the actuarial functions of the system disturb its rational but unconscious automation. Residual human actions like Sarao’s are in this perspective essential but dangerous.
Because financial visualisations no longer describe human subjects, the subjectivities they enable or create have only a very selective range of human attributes. One of the arguments for algo-trading is that machines have no guile or hidden motives: they are the embodiment of the pure rationality that neo-liberal economics believes governs the market, but which has had to be invented in computerised form in order to exist, which requires legislation like the Dodd-Frank Act (interestingly passed into law a couple of months after the Flash Crash) to control the irrational outcomes of pure market reason, and which requires the suppression of even such minimal acts as Sarao’s to achieve its imagined perfection.
The time of the machine (as celebrated by Ernst, ‘Cultural Archive’) is fatal because in it the future—the market in futures—is reduced to the present, the only time of profit; just as the future is the only time of debt. As the now-dominant mode of time (Ross, ‘Accumulation’), debt defers everything to a lonely instant of final resolution that never comes. In the place where Panovsky saw the ideal universal Man as the ineffable subject of perspective, debt offers an ideal, universal and ineffable subject of finance. Today neither politics (as administration of public affairs) nor economics offers us a means to work through and against this triumph of the corporate cyborg. The task requires an aesthetics: something that will allow us a means of communication, of forming a commons, in the age of seven billion humans, a commons that embraces those humans and non-humans currently governed but excluded from their own government. A fundamentally aesthetic politics.
Note
Based on a paper originally presented at the Ctrl-Z research symposium, geo- (the earth and the earth sciences in humanities inquiry), Curtin University, Perth, November 28-30, 2016.
References
Badiou, Alain. Theory of the Subject, trans. Bruno Bosteels. London: Bloomsbury, 2009.
Beer, Stafford. Cybernetics and Management. London: English Universities Press, 1959.
Beunza, Daniel and Yuval Millo. Blended Automation: Integrating Algorithms on the Floor of the New York Stock Exchange. Systemic Risk Centre Discussion Paper No 38 (May). London: LSE, 2014.
Bourne, Clea. Trust, Power and Public Relations in Financial Markets. London: Routledge, 2016.
Bruckner, Monica Z. ‘Ion Chromatography’.
Cassirer, Ernst. The Philosophy of Symbolic Forms. Volume 1: Language; Volume 2: Mythical Thought; Volume 3: The Phenomenology of Knowledge, trans. Ralph Manheim and introd. Charles W. Hendel. New Haven: Yale University Press, 1965 [Ger.1923, 1925, 1929].
Cubitt, Sean. ‘Against Connectivity’, NECS European Network for Cinema and Media Studies 2016 Conference: Potsdam, Germany, 28-30 July 2016.
Daston, Lorraine and Peter Galison. Objectivity. Cambridge MA: MIT Press, 2010.
Davison, Jane. ‘Visualising Accounting: An Interdisciplinary Review and Synthesis’. Accounting and Business Research 45, 2 (2015): 121-165.
Drucker, Johanna. Graphesis: Visual Forms of Knowledge Production. Cambridge MA: Harvard University Press, 2014.
Edwards, Paul N. A Vast Machine: Computer Models, Climate Data, and the Politics of Global Warming. Cambridge MA: MIT Press, 2010.
Eliot, T.S. 'Burnt Norton', in Collected Poems 1909-1962. London: Faber, 1963, pp. 189-195.
EPA. Post-Gold King Mine Release Incident: Conceptual Monitoring Plan for Surface Water, Sediments, and Biology. March. Washington DC: Environmental Protection Agency, 2016.
Ernst, Wolfgang. ‘Cultural Archive versus Technomathematical Storage’, in The Archive in Motion, ed. Eivind Røssaak. Oslo: Novus Press, 2010, pp. 53-73.
Fox Talbot, William. The Pencil of Nature. London: Longman, Brown, Green & Longmans, 1844.
Galison, Peter. Image and Logic: A Material Culture of Microphysics. Chicago: University of Chicago Press, 1997.
Galison, Peter. Einstein’s Clocks, Poincaré’s Maps: Empires of Time. New York: Norton, 2003.
Griffiths, Anthony. Prints and Printmaking: An Introduction to the History and Techniques, 2nd ed. London: British Museum Press, 1996.
Gee, Lind S. and William S. Leith. The Global Seismographic Network. Washington DC: United States Geological Survey, 2011.
Gitelman, Lisa. Paper Knowledge: Toward a Media History of Documents. Durham NC.: Duke University Press, 2014.
Graham, Stephen D.N. ‘Software-sorted geographies’. Progress in Human Geography 29, 5 (2005): 562-580.
Halpern, Orit. Beautiful Data: A History of Vision and Reason Since 1945. Durham NC: Duke University Press, 2014.
Ivins, William M. Jnr. Prints and Visual Communication. Cambridge MA: MIT Press, 1953.
MacKenzie, Donald, Daniel Beunza, Yuval Millo and Juan Pablo Pardo-Guerra. ‘Drilling Through the Allegheny Mountains: Liquidity, Materiality and High-Frequency Trading’. Journal of Cultural Economy 5, 3 (2012): 279-296.
Marx, Karl. Grundrisse, trans. Martin Nicolaus. London: Penguin/New Left Books, (1973).
Mukerji, Chandra. From Graven Images: Patterns of Modern Materialism. New York: Columbia University Press, 1983.
Nebeker, Frederik. ‘Appendix B: The Development of Very-Broad-Band Seismography: Quanterra and the IRIS Collaboration’, in AIP Study of Multi-Institutional Collaborations: Phase II: Space Science and Geophysics, Report No.2 Documenting Collaborations in Space Science and Geophysics, ed. Joan Warnow-Blewett, Anthony J. Capitos, Joel Genuth & Spencer R. Weart with contributions by Frederik Nebeker, Lynne Zucker & Michael Darby. New York: American Institute of Physics, 1995.
Needham, Joseph. Science and Civilization in China, Volume 3: Mathematics and the Sciences of the Heavens and the Earth. Cambridge: Cambridge University Press, 1959.
New Mexico. Hydrology Protocol for the Determination of Uses Supported by Ephemeral, Intermittent and Perennial Waters. Surface Water Quality Bureau: New Mexico Environment Department, 2011.
Parikka, Jussi. A Geology of Media. Minneapolis: University of Minnesota Press, 2015.
Philips, Matthew. ‘Why Oklahoma Can’t Turn Off Its Earthquakes’. Bloomberg Businessweek, 7 November 2016.
Playfair, William. The Commercial and Political Atlas and Statistical Breviary. Cambridge: Cambridge University Press, 2005.
Priestley, Joseph. A Description of a New Chart of History: Containing a View of the Principal Revolutions of Empires that have Taken Place in the World. London: J Johnson, 1786.
Pryke, Michael. ‘Money’s Eyes: The Visual Preparation of Financial Markets’. Economy and Society 39, 4 (2010): 427–459
Reitherman, Robert. Earthquakes and Engineers: An International History. Reston, VA: ASCE Press, 2012.
Reuters. ‘British Trader Pleads Guilty to Wire Fraud after US Extradition’. The Guardian, 9 November 2016.
Ross, Andrew. ‘Accumulation and Resistance in the 21st Century’, in MoneyLab Reader: An Intervention in Digital Economy, ed. Geert Lovink, Nathaniel Tkacz & Patricia de Vries. Amsterdam: Institute of Network Cultures, 2015, pp. 64-73.
Rossiter, Ned. Software, Infrastructure, Labour: A Media Theory of Logistical Nightmares. London: Routledge, 2016.
Sánchez-Rodas, D., W.T. Corns, B. Chen and P.B. Stockwell. ‘Atomic Fluorescence Spectrometry: A Suitable Detection Technique in Speciation Studies for Arsenic, Selenium, Antimony and Mercury’. Journal of Analytical Atomic Spectrometry 25, 7 (2010): 933-946.
Virilio, Paul. Un paysage d’événements. Paris: Galilée, 1996.
Whyte, William H. The Organization Man. New York: Simon & Schuster, 1956.
Wilkins, Inigo and Bogdan Dragos. ‘Destructive Destruction? An Ecological Study of High Frequency Trading’. Mute, 22 January 2013.
Ctrl-Z: New Media Philosophy
ISSN 2200-8616